How to Understand Engagement
What engagement actually counts, why the same post shows different numbers on different networks, and which figures are worth reading.

Quick guide
Engagement is the total of the responses a post got. Which responses count, and whether reach is reported at all, changes by network, so compare a post against your own history on the same platform, never across platforms.
- Read engagement as the sum of likes, replies, reposts and whatever else that network reports.
- Check whether the network publishes impressions. LinkedIn, Bluesky and Mastodon don't, so there's no engagement rate to calculate.
- Compare against your own median on the same network. Cross-network comparison doesn't mean anything.
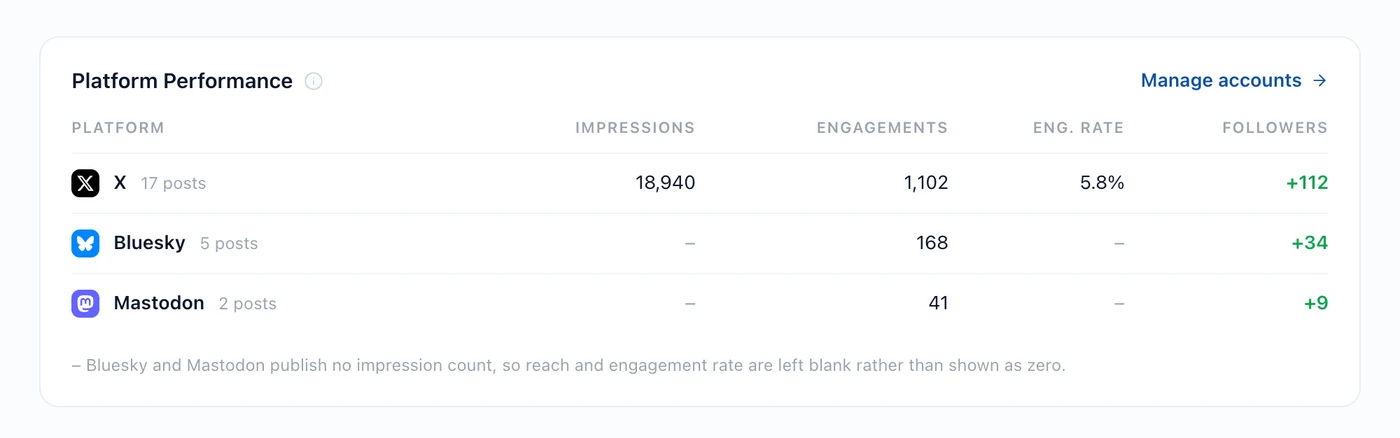
- Treat a blank as a blank. We leave an unreported metric empty rather than showing a zero.
- Look at replies separately from likes. A like is a reflex; a reply is a decision.
The full walkthrough is below.
Engagement is the most quoted number in social media and one of the least well defined. Two dashboards can report different engagement for the same post and both be right, because they're counting different things.
So: what engagement actually is, which numbers each network hands over, and how to read them without drawing a conclusion the data doesn't support.
What engagement counts
Engagement is the total of the actions people took on your post. Which actions exist is up to the network, and they don't agree:
- X counts likes, replies, reposts, quotes and bookmarks, and reports profile clicks and link clicks separately.
- LinkedIn counts reactions and comments.
- Instagram counts likes and comments.
- Facebook counts reactions, comments and shares.
- Threads counts likes, replies, reposts and quotes.
- TikTok counts likes, comments and shares.
- Bluesky counts likes, replies, reposts and quotes.
- Mastodon counts favourites, replies and boosts.
- Pinterest counts saves and outbound clicks. No likes at all.
Same shapes, different words. A repost on X is a share on LinkedIn and a boost on Mastodon. Hyvo uses each network's own word instead of picking one and mislabelling the rest, so the number under a LinkedIn post says Reactions and the one under a Mastodon post says Favourites. Calling LinkedIn comments "replies" is just wrong, and we'd rather not.
The metric half the networks don't publish
This is the one that surprises people. Several networks don't tell you how many people saw a post.
Where reach comes from, by network:
| Network | Reach figure | Called |
|---|---|---|
| X | Yes | Impressions |
| Threads | Yes | Views |
| TikTok | Yes | Views |
| Yes | Impressions | |
| No, for member posts to third-party apps | None | |
| Bluesky | No. The protocol publishes none | None |
| Mastodon | No | None |
| No | None | |
| No | None |
Engagement rate is an argument about the denominator
Engagement rate is engagements divided by something, and which something is the entire argument:
- Divided by impressions: of the people who saw it, how many responded? The most meaningful version, and only available where the network reports reach.
- Divided by followers: how much of your audience responded? Stable and comparable over time, but wrong whenever a post reaches past your followers.
- Divided by reach: similar to impressions, but counting people instead of views.
Two tools quoting different engagement rates for the same post are usually just dividing by different things. When somebody quotes a rate at you, the useful question is what's underneath the line.
Where a network publishes no reach at all, there's no honest rate to calculate. Read the raw counts instead. They're still comparable against your own history, which is the comparison that matters.
Not all engagement weighs the same
A like costs nothing. A reply costs a sentence and the risk of being wrong in public. A share costs putting your name next to yours. They aren't interchangeable, and averaging them into one number hides the difference.
Roughly what each signal is worth:
| Signal | What it tells you |
|---|---|
| Like | It wasn't bad. Close to a reflex. |
| Save or bookmark | Somebody expects to need it again. |
| Reply or comment | It provoked a thought worth typing. |
| Repost or share | Somebody put their name next to it. |
| Profile click | The post worked, and they came looking for more. |
A post with fifty likes and no replies and a post with ten likes and eight replies are telling you completely different things. The second one found people who care.
Reading it in Hyvo
Every published post in the library carries its own numbers, in the network's own words.

Analytics aggregates the same data with a date range and a comparison. The Overview section answers "how am I doing?"; the platform table shows the split, including where a network reported nothing at all.
How to read engagement without fooling yourself
- Compare against your own median on the same network. Not against an industry benchmark, and not against another network.
- Look at the trend, not the post. One good post is variance. Six weeks of movement is a signal.
- Keep reach and response separate. Reach is distribution: whether the platform showed it. Response is content: whether it was worth reacting to. Mixing them up means fixing the wrong thing.
- Check the sample. Patterns from twenty posts are directions to test. Finding your best-performing content covers how much weight to give one.
Where people go wrong
- Comparing engagement rates across networks. Different actions, different denominators, different audiences. It isn't a comparison.
- Chasing likes. The cheapest signal to get and the least informative one.
- Reading a dash as bad performance. It means the network published nothing.
- Judging a post on day one. Networks report on their own schedule and some numbers arrive late.
FAQs
What's a good engagement rate?
There's no useful universal answer. It depends on network, audience size and content type. The number worth knowing is your own median, and whether you're above it.
Why doesn't LinkedIn show impressions in Hyvo?
LinkedIn doesn't publish an impression count for member posts to third-party applications. We report what the network returns and leave the rest blank.
Why do my numbers differ from the network's own dashboard?
Networks recalculate over time, and different dashboards read at different moments. Small differences are normal. Use one source consistently rather than trying to reconcile them.
Do followers count as engagement?
No. Follower change is tracked separately because it measures something else: whether people wanted more, rather than whether they responded to one post.
Which metric should I actually watch?
Replies and saves, plus follower change over months. They're harder to move and harder to fake than likes.
About the author

Founder, Hyvo
Subarna Basnet is the founder of Hyvo, an AI-powered platform helping businesses create, manage, and automate social media marketing. He writes about AI, social media automation, content creation, and marketing technology.