
See what worked, and send the report
One score for how an account is doing, the numbers under it, and a report you can hand over.
Free to start. No card needed.
Social Health
One score, and what moves it
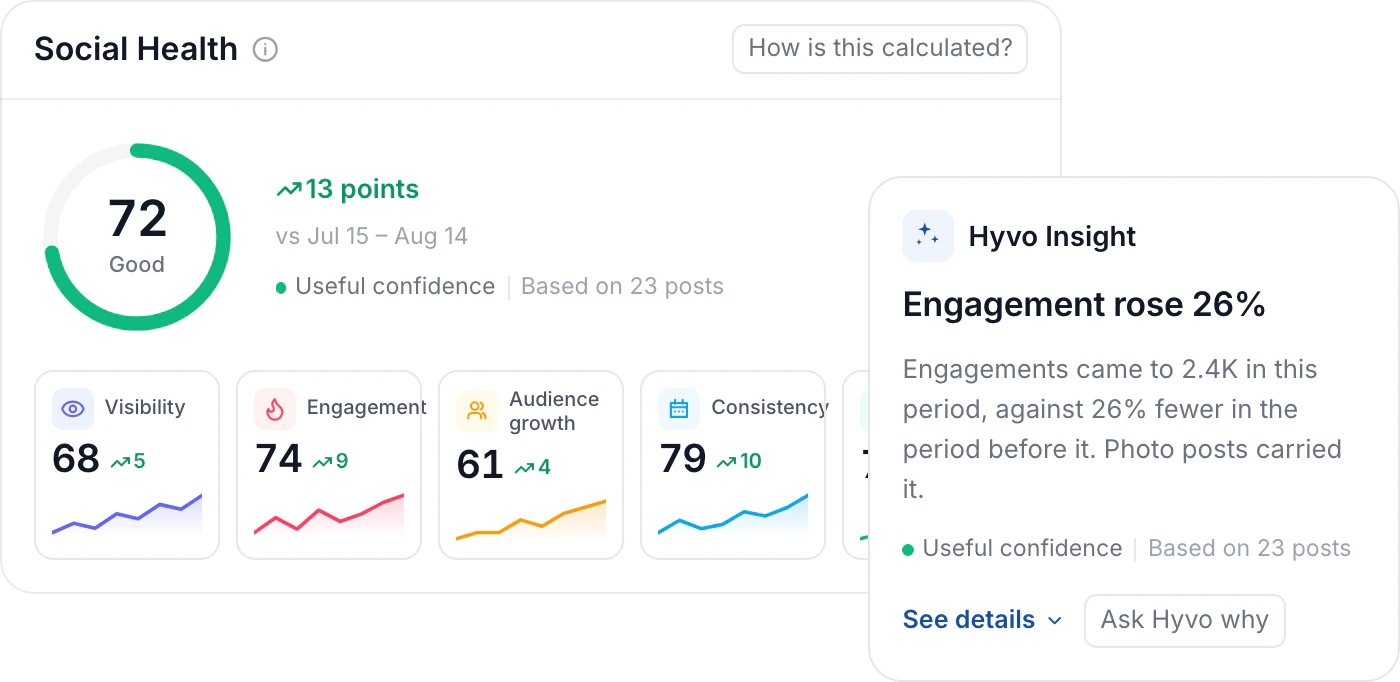
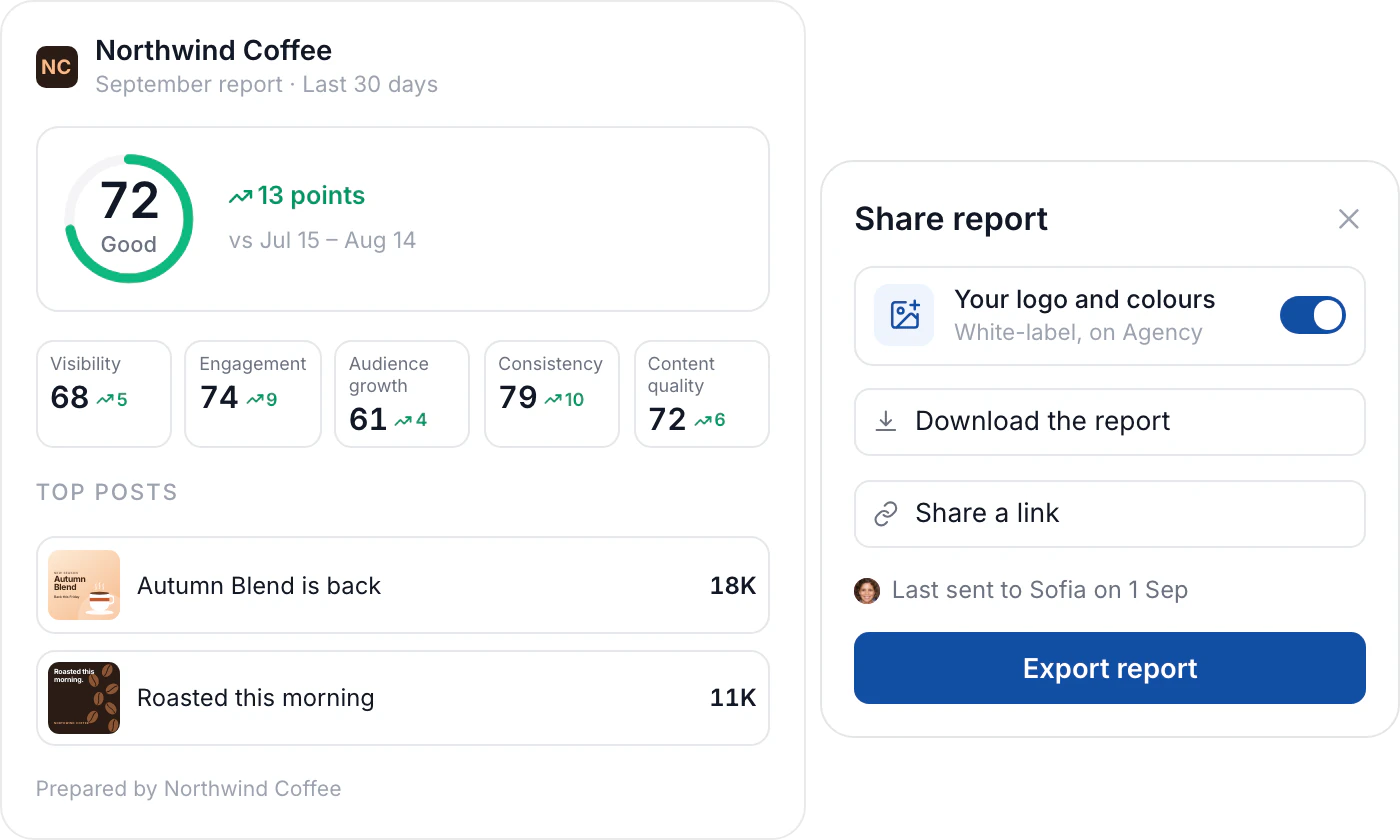
Social Health puts an account into a single number, then splits it into five parts, so you can see which one moved and which is holding you back.
- Visibility, engagement, audience growth, consistency and content quality
- Each part set against the period before
- A part it cannot measure yet says so, instead of showing a zero
Patterns
What works here, and when
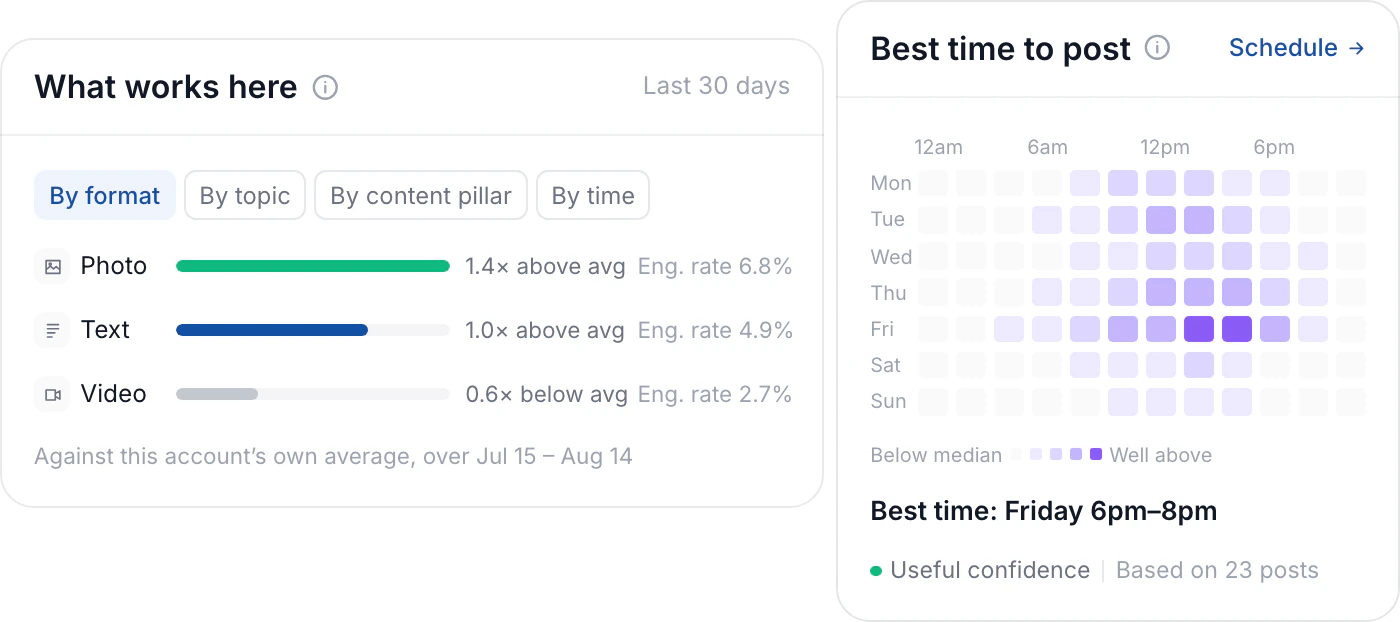
Formats, topics and pillars are scored against your own average, and your posting history gives the hours worth taking.
- Ranked against your own average
- A best-time heatmap from your posts
- Schedule from the hour it points at
Hyvo Chat
Ask instead of digging
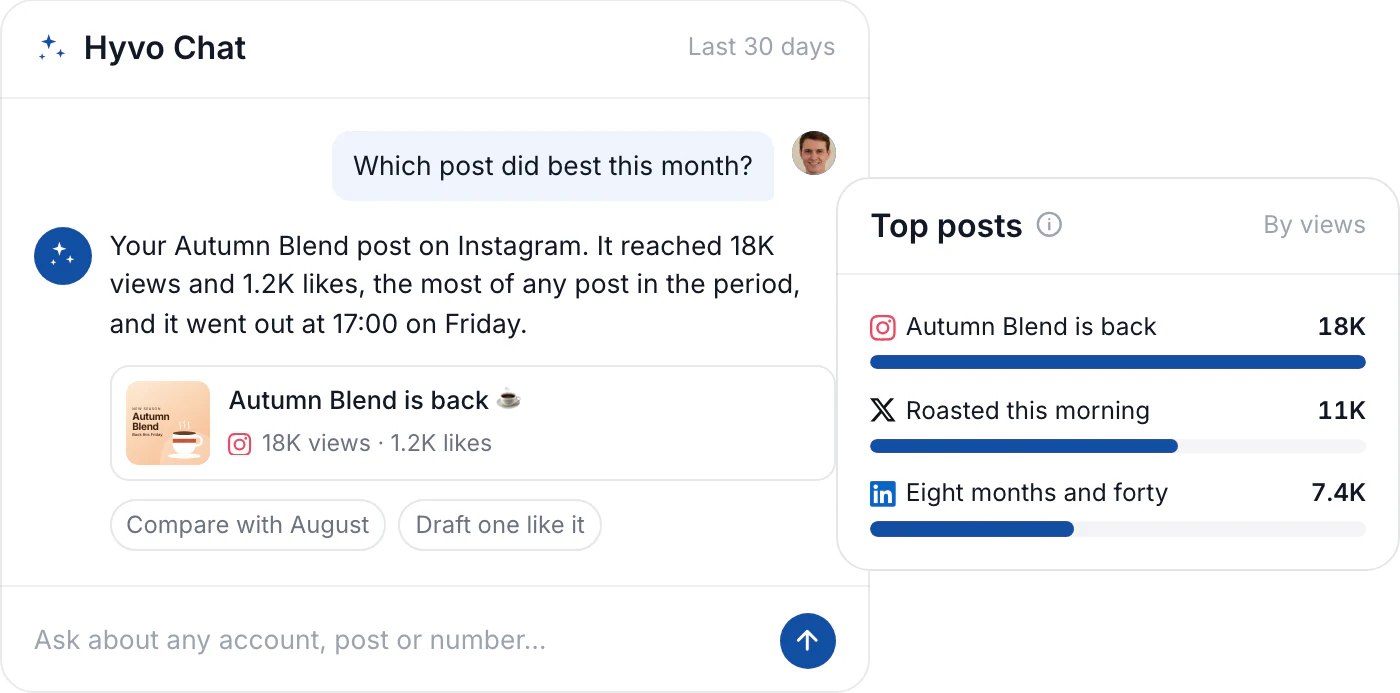
Ask about any account, post or number, or ask why a figure moved. The answer comes back in plain words, with the numbers under it.
- Ask in plain language
- Every answer shows its numbers
- Market and competitor research on Premium
Reports
A report worth sending
Turn a period into something a client or a manager can read: the score, the trend and the posts that did the work.
- Reports and exports from Premium
- Your own branding on Agency and Business
- A year of history on Premium and Agency
Numbers you can act on
What the analytics give you beyond another chart.
One number
Five parts rolled into a single score, with the band it sits in.
Always compared
Every figure sits next to the period before it.
Confidence, stated
Each score says how many posts it rests on.
Times that worked
The week is shaded by how your own posts did, hour by hour.
Blank, not zero
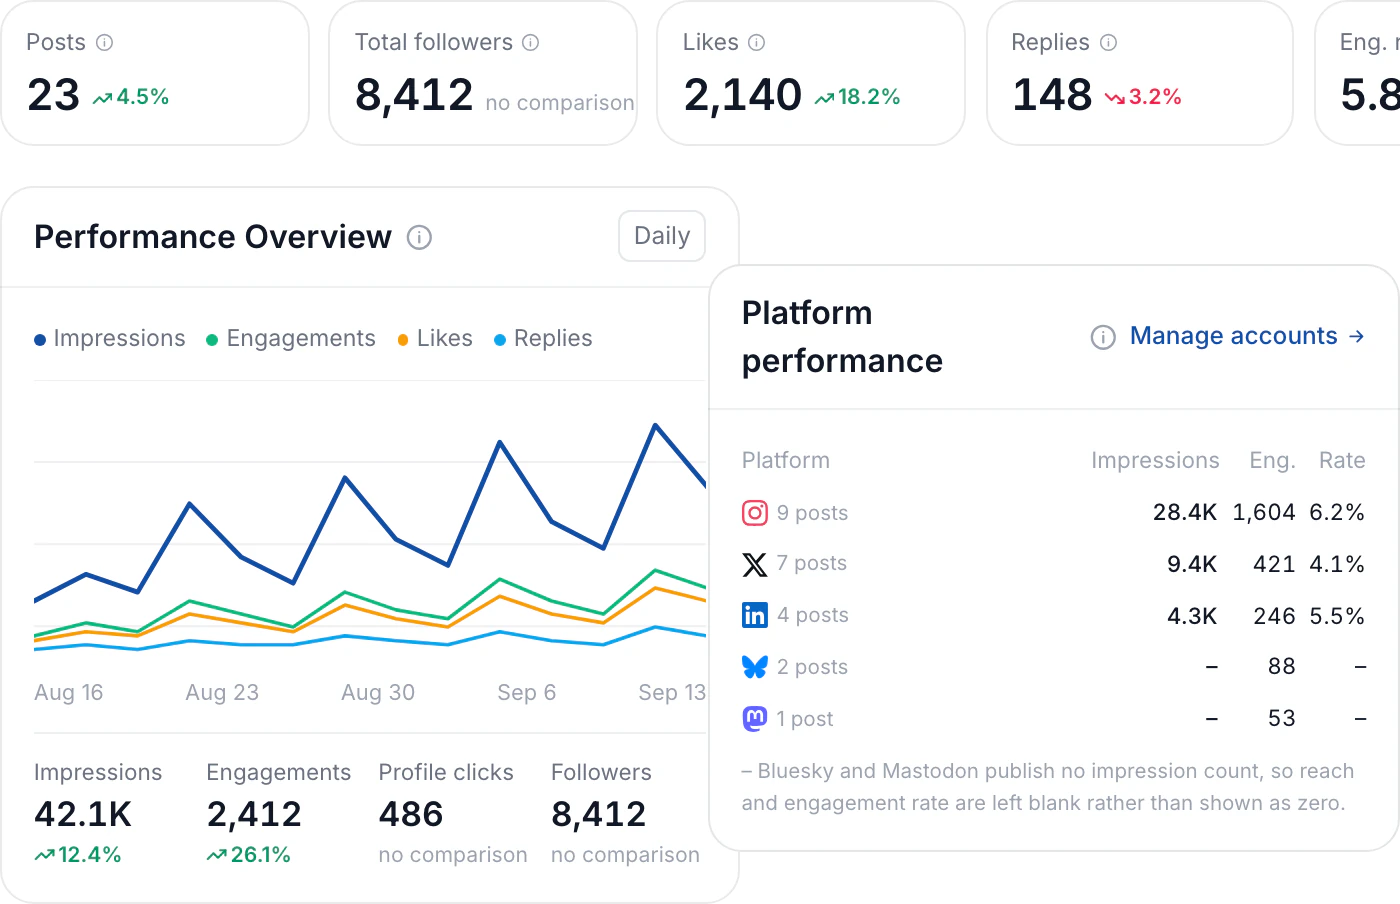
Bluesky and Mastodon publish no reach, so it is left blank.
Exports built in
Download a report or share a link. Premium and above.
Questions about analytics
What is Social Health?
One score for how an account is doing, split into visibility, engagement, audience growth, consistency and content quality. Each part is compared with your previous period.
What comes with the Free plan?
Basic analytics with 30 days of history. Premium and above add advanced analytics, a year of history, and reports.
Can I export reports for clients?
Yes, from Premium up. Agency and Business add your own branding.
How far back does history go?
30 days on Free, a year on Premium and Agency, a custom range on Business.
Why are some numbers blank?
Because the network does not publish them. Bluesky and Mastodon give no reach figure, so it stays blank rather than reading as zero.
How does best time to post work?
It reads your own posts by day and hour, shades the week by how they did, and names the best window with the number of posts behind it.